Most traders learn about support and resistance in their first week. However, very few learn what happens after a key level fails. That failure often leaves a clear footprint on the chart. In smart money concepts, this footprint is known as a breaker block.
Over two decades of studying price action, I have watched one pattern repeat across forex, crypto, indices, and stocks. Failed zones rarely vanish. Instead, they often flip roles and become fresh areas of interest. A breaker block trading strategy is built around this simple but powerful idea.
In this guide, you will learn how to build a breaker block trading strategy step by step. We will cover the definition, market structure, entries, stops, and targets. We will also compare breaker block vs order block setups, so you can tell them apart with confidence.
A breaker block is a former order block that failed to hold. At first, price respected the zone. Then the market broke through it with strong momentum and created a new structure. When price later returns to that broken zone, it often reacts from the opposite side.
Think of it as a broken wall that now acts as a floor or a ceiling. For example, a zone that once pushed price lower can later support a move higher. This shift happens for a logical reason. Traders who got trapped on the wrong side often exit near breakeven. Meanwhile, larger participants may add positions in the new direction.
In short, a breaker block shows where the market changed its mind. That is exactly why it offers useful information for timing entries.
Many traders confuse these two concepts. Although they look similar on a chart, they tell very different stories.
An order block is the last opposing candle before a strong move. For instance, the last bearish candle before a sharp rally marks a bullish order block. Traders expect price to respect this zone when it returns.
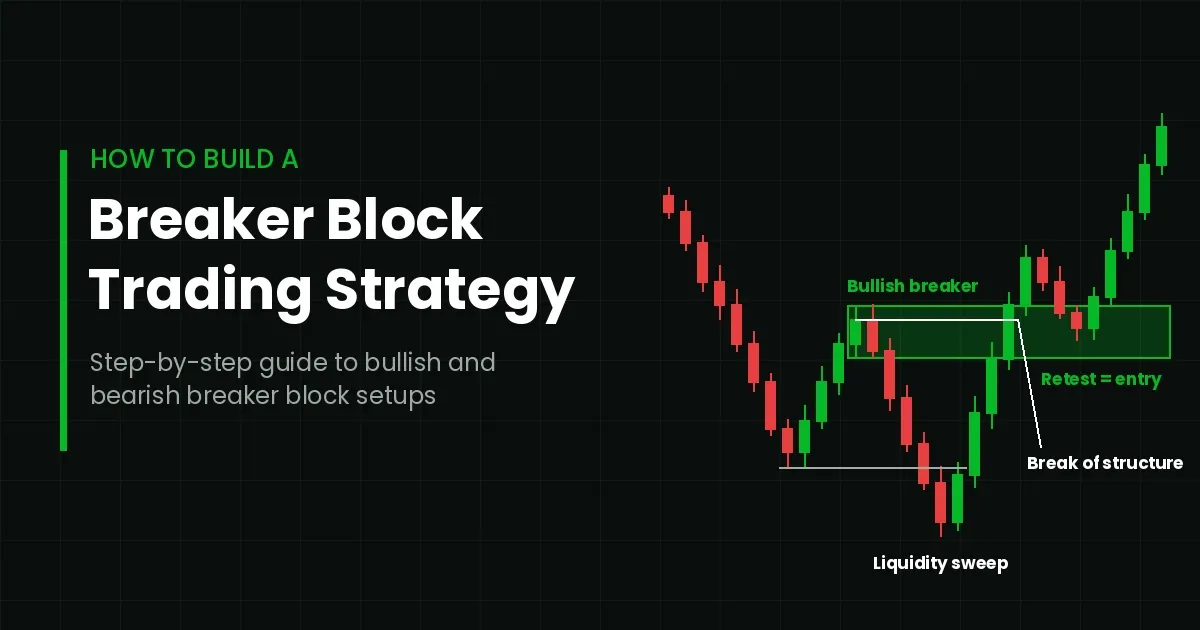
A breaker block, on the other hand, begins life as an order block that failed. Price did not respect it. Instead, the market swept liquidity, broke structure, and closed through the zone. As a result, the old zone flipped its role.
Here is how the breaker block vs order block comparison works in practice:
Therefore, you should never treat them as the same trade. Each one needs its own rules, its own confirmation, and its own risk plan.
Understanding the bullish and bearish breaker block is the heart of this method. Both follow the same logic, but they work in opposite directions.
A bullish breaker block usually forms when a downtrend starts to lose strength. The sequence often looks like this:
When price pulls back into this zone, buyers often step in. In effect, the failed bearish order block now behaves like support.
A bearish breaker block is the mirror image. It typically appears near the end of an uptrend.
When price rallies back into this zone, sellers often defend it. Consequently, the failed bullish order block now acts as resistance.
The liquidity sweep is the detail most traders skip. Yet it is the clue that separates a genuine bullish and bearish breaker block from random noise.
Now let us turn theory into a repeatable process. Follow these eight steps in order. Each one filters out weak setups before you risk any capital.
First, pick one market and learn its rhythm. Liquid markets such as major forex pairs, gold, large-cap stocks, or Bitcoin tend to produce cleaner structure.
Next, choose two timeframes. Use a higher timeframe for direction and a lower one for entries. A common pairing is the 4-hour chart with the 15-minute chart. Swing traders may prefer the daily chart with the 1-hour chart. Whatever you choose, stay consistent.
Before you hunt for any breaker, define the trend. Are highs and lows rising, falling, or moving sideways?
This step matters more than most traders admit. A breaker block trading strategy works best when the setup agrees with higher timeframe bias. For example, a bullish breaker inside a higher timeframe uptrend carries more weight than one fighting the trend.
Now drop to your entry timeframe. Look for price to run beyond an obvious high or low. Equal highs, equal lows, and clear swing points are common targets.
The sweep often looks like a sharp wick or a quick false breakout. It shows that stop orders were taken out. Without this sweep, the setup loses much of its edge.
After the sweep, price must reverse with intent. In a bullish setup, it should close above the most recent swing high. In a bearish setup, it should close below the most recent swing low.
Always wait for a candle close, not just a wick. A strong, decisive close confirms that control has shifted. Many traders also look for a fair value gap during this move. A gap suggests the shift happened with real momentum.
Next, draw the zone. For a bullish breaker, mark the last up-close candle before the sweep. For a bearish breaker, mark the last down-close candle before the sweep.
Most traders mark the full candle range, from high to low. Some prefer the body only for a tighter zone. In addition, note the midpoint of the zone. Price often reacts near this level, which is sometimes called the mean threshold.
Patience is where most accounts are saved. Do not enter the moment the zone appears. Instead, wait for price to return to it.
When price reaches the zone, look for confirmation on your lower timeframe. A rejection wick, an engulfing candle, or a small shift in structure can all work. If price slices through the zone and closes beyond it, the setup is invalid. Simply move on.
Your entry can sit at the edge of the zone, at its midpoint, or after confirmation. Each option trades fill rate for precision. Test them and pick one.
Place your stop loss beyond the far side of the breaker block. Even better, place it beyond the liquidity sweep extreme. That level marks the point where your idea is clearly wrong.
For targets, aim at the next pool of liquidity. Opposing swing highs or lows, untested order blocks, and session highs or lows all work well. Many traders take partial profits at a 1:2 risk-to-reward ratio. They then move the stop to breakeven and let the rest run.
No strategy deserves real money until it has been tested. Go back through at least 100 historical setups on your chosen market. Record the entry, stop, target, and outcome for each one.
Afterward, forward test on a demo account for several weeks. Keep a journal with screenshots. Over time, patterns will appear. You may notice that certain sessions or timeframes perform better. Use those findings to refine your rules.
Even a solid breaker block trading strategy can fail if you apply it carelessly. Watch out for these frequent errors:
No setup wins every time. For this reason, risk management decides your long-term results more than entries do.
Risk a fixed percentage of your account on each trade. Most experienced traders keep this between 0.5% and 2%. Also, set a daily loss limit. If you hit it, stop trading for the day.
In addition, avoid trading right before major news releases. High-impact events can blow through any zone, no matter how clean it looks. Finally, review your journal every week. Honest reviews reveal the habits that cost you money.
Yes, the concept applies to every timeframe. However, lower timeframes produce more noise. Beginners usually get clearer results on the 15-minute chart and above.
An order block trade expects a zone to hold. A breaker block trade expects a failed zone to flip its role after a liquidity sweep and a break of structure.
A breaker stays valid until price closes decisively through it. Once that happens, remove it from your chart.
A breaker block trading strategy rewards patience and discipline. First, read the higher timeframe. Then wait for the sweep, the break, and the retest. Most importantly, protect your capital on every trade. With steady practice and careful journaling, these failed levels can become some of the clearest areas on your chart.
Many traders also pair their manual analysis with indicators to save time on chart reading. If you explore such tools, you may come across questions like "is GainzAlgo legit" while researching options. The sensible answer applies to GainzAlgo and every other tool: test it on a demo account, compare its signals with your own breaker block rules, and judge it on your own data rather than on claims.

This post has been authored and published by one of our premium contributors, who are experts in their fields. They bring high-quality, well-researched content that adds significant value to our platform.